Wednesday 1 October 2008

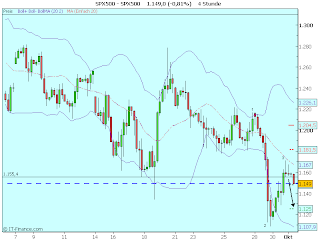
S&P: 1 October 2008

It seems that the consolidation until point 2 is over. A test of lows is likely.

Wednesday 24 September 2008

Dow Jones: 24 Sep 2008

Based on daily chart is Dow Jones in a downtrend. Break of yesterday's low could signal the test of 10.500 e.g. low of 18 September. Only break of yesterday's high might change the picture.

Monday 22 September 2008

S&P 500 Futures: 22 Sep 2008

The uptrend (which began on Friday) is still intact based on 4h chart. I favor a test of highs of Friday. However, a break of the point 3 in the chart might signal a reversal.

Thursday 18 September 2008

Apple: What's going on?


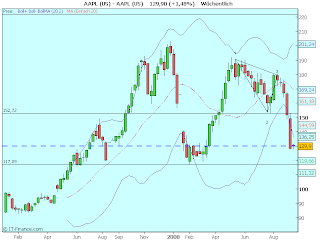
One friend asked me to look at Apple (weekly chart, each candle represents 1 week). After 123high (see triangle) Apple is now in downtrend. I see around 117 as next target. Above 153 we have to make a new picture of the situation.

Euro Dollar Chart Analysis: Time for rebound?

It seems that we are witnessing a 123low in daily eurodollar chart. A break of the line might signal a rebound and a target of 1,48. Watch out...

Wednesday 17 September 2008

S&P 500: 17 September 2008, Opening

The downtrend (4hours chart) in spx is still ongoing, as SPX500 was not able to make a new high. Test of the lows of yesterday are possible. We will observe: Will SPX make a new low daily low or not?
 
Please read: All of the information on this website is for entertainment and educational purposes only. While the information is believed to be accurate and the analysis is honestly offered, none of the information on this site should be considered solely reliable for use in making actual investment decisions.